Analyzing TACL publication patterns
This writeup is intended as an add-on for Marek Rei’s post on NLP publication patterns. I think – also confirmed by the comments of that blog post – that a similar analysis focusing this time on TACL publications could be of public interest. Hence, I decided to do some work in that respect. Hopefully, some members of the community would find the followings useful.
From a personal side, this project was also a great excuse to keep my python scripting skills alive and also to test the indulgence of Google Scholar against automatic queries. In order to save others from the excitement of being temporarily banned from Google Scholar I made the datasets I collected (reflecting the state as of 30.12.2016) available as a pandas dataframe in json format.
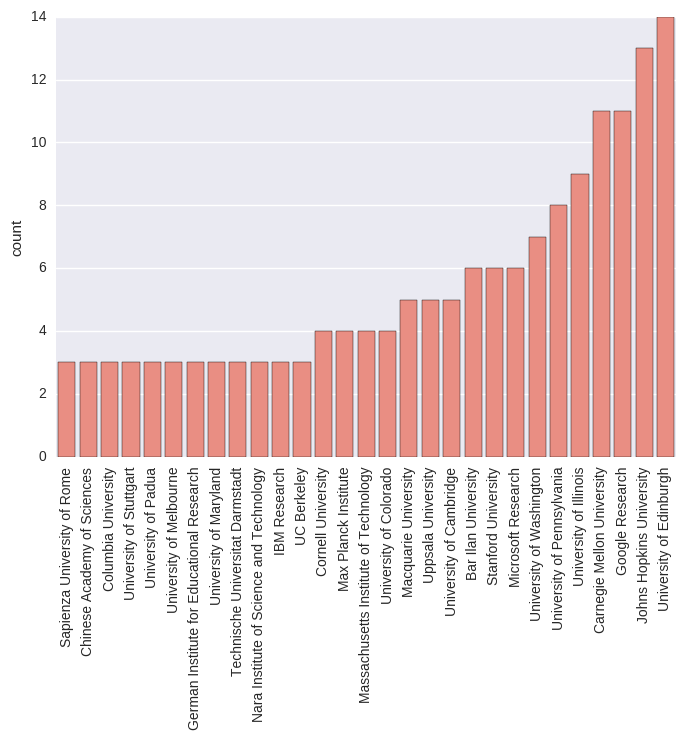
First thing first, the following figure contains institutions with highest presence in TACL. Affiliations assigned to a paper were treated as a set (so if more author of a publication shared an institution that institution got counted once) and no partial assignment of institutions were employed (meaning that a paper assigned to multiple institutions counted as one presence for all the institutions being involved in a paper). After creating a normalization dictionary for institution names 111 distinct institutions were identified among the authors’ affiliations. The below figure depicts those 29 institutions that were aligned to at least 3 TACL papers in the analysis.
The below table provides the comparison of the TACL and conference presence of different institutions for the top-15 institutions according to Marek Rei’s analysis. It can be seen that the different institutions often have different ranks in the two ordering, probably due to the different objectives and preferences for conference and journal presence at different institutions.
| Institution | TACL-based rank | Rank in Marek Rei’s list |
|---|---|---|
| Carnegie Mellon University | 3 | 1 |
| Microsoft Research | 8 | 2 |
| Stanford University | 8 | 3 |
| Google Research | 3 | 4 |
| Columbia University | 18 | 5 |
| UC Berkeley | 18 | 6 |
| Massachusetts Institute of Technology | 14 | 7 |
| University of Washington | 7 | 8 |
| IBM | 18 | 9 |
| University of Edinburgh | 1 | 10 |
| University of Cambridge | 11 | 11 |
| Johns Hopkins University | 2 | 12 |
| UT Austin | 31 | 13 |
| Princeton University | 44 | 14 |
| University of Pennsylvania | 6 | 15 |
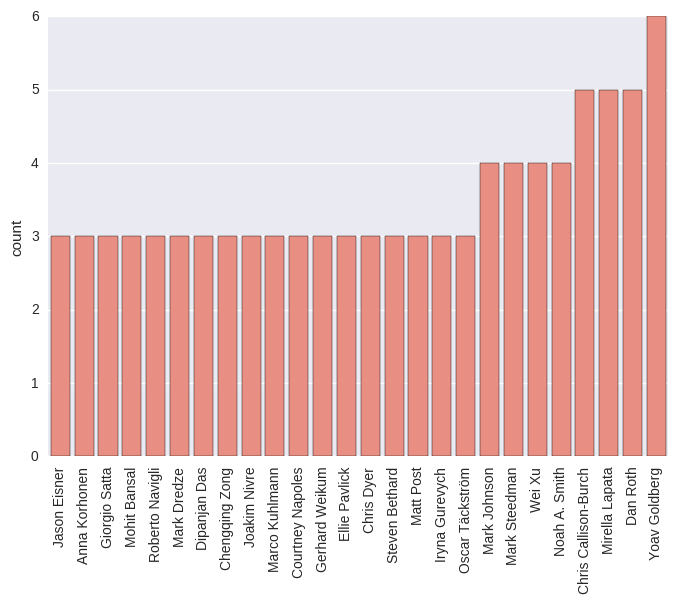
Note that the University of Illinois and Bar Ilan University did not get to the top-15 list in Marek’s collection, however, they are ranked 5th and 8th in the ordering based on TACL presence with 9 and 6 papers being accepted to the journal, respectively. Regarding the 6 TACL papers from Bar Ilan University, all of them had Yoav Goldberg among their authors which makes him the most prolific author at TACL as of the end of 2016. What makes this achievement more impressive is that half of his papers are from 2016 alone. There are 25 further authors who have at least 3 TACL papers published by the end of 2016 listed in the below bar chart.
During the last year I was about to get a paper accepted to TACL. After my first re-submission ened up in a type-c decision, I was wondering if I should do a revision of the paper and resubmit it. Since the footers of papers include how many times (and when) a certain accepted paper was revised I was able to make some statistics to help me make the decision. That was the time I wrote the first version of my script relying on Tika which got extended since then in several ways. Following are my findings regarding the analysis of the resubmissions to TACL.
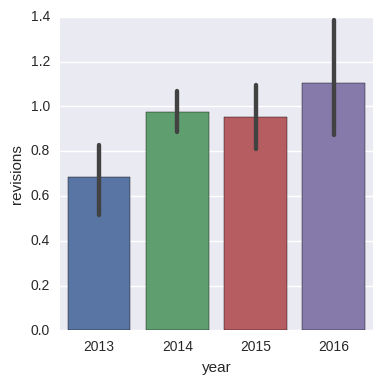
The below figure illustrates that there has been a steady (roughly 70%) growth in the average number of revisions for papers compared to the beginnings. A reason could be that authors became more persistent, but a more serious explanation for that could be the relative young age of the journal. Even though TACL has a reputable turn-around time, papers that were accepted after 3 or more revisions simply could not make it for the first years, thus their effect of increasing the average number of revisions had to have a delayed appearance.
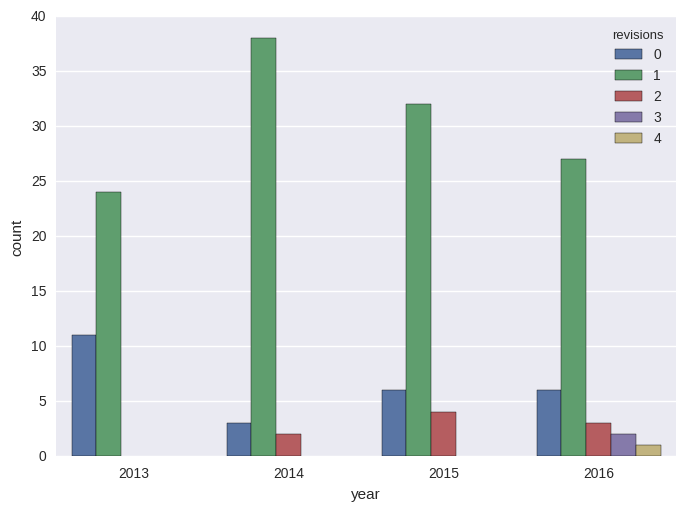
The distribution of the actual number of revisions for papers published in a certain year are listed below revealing the previously mentioned phenomenon, that is papers accepted after at least 3 revisions were not present before 2016.
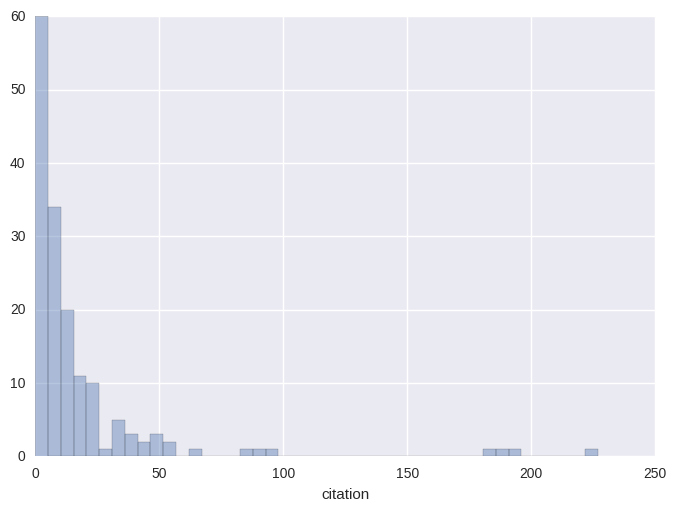
Out of curiosity, I checked out the number of citations accepted papers received up to the end of 2016 using Google Scholar and the scholar.py script. The kind of power distribution shown in the figure below is pretty much what would be expected.
I created some plots to visualize the average number of citations papers with a certain number of revisions received. Looking at the figure one could possibly argue that the number of revisions before a paper gets accepted could reveal if a paper is controversial, which could then affect the number of citations a paper would receive later on. While the below picture seems to be supportive towards that claim, such a far-reaching conclusion should not be made based on it. First of all, there are only 3 papers in total with at least 3 revisions and all of them are from year 2016, so they had little time to receive citations. The arXiv or not to arXiv dilemma – Kyunghyun Cho also had a blog post on – could also bias the figures (especially for year 2016) as certain authors might tend to share the preprint version of their work even before acceptance, which could possibly result in papers which have several citations on the very first day of their official day of publication. Of course, these effects diminish as a paper ages, but makes the judgment of lately published papers cumbersome.
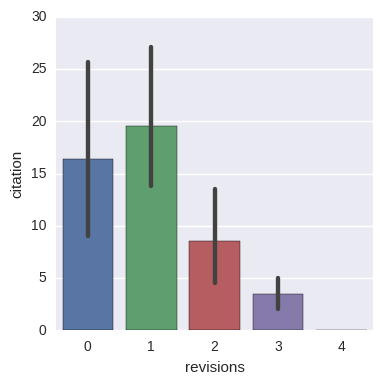
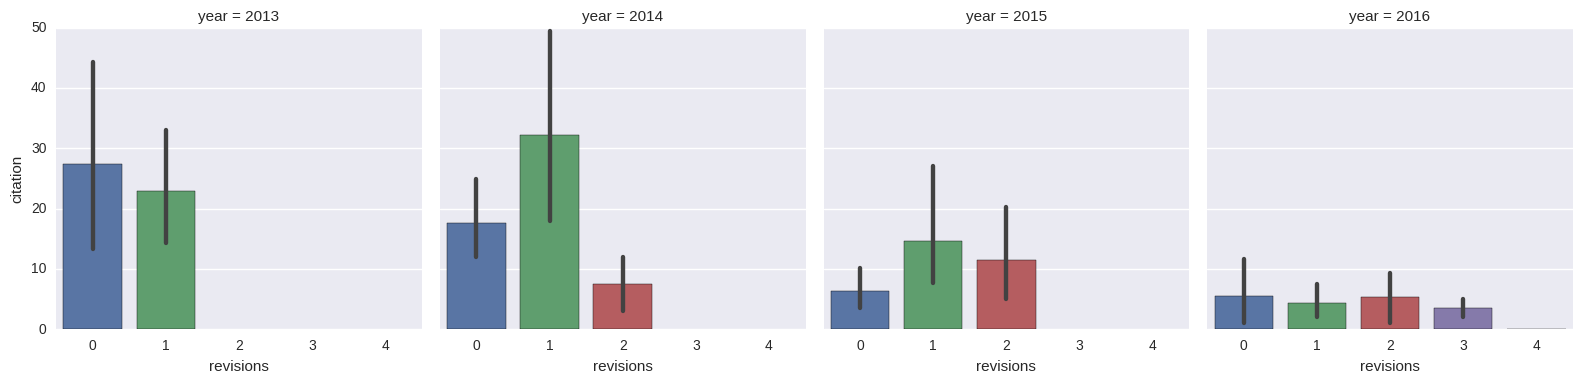
A conclusion I think nevertheless can be drawn from the previous figure is that papers with one revision tend to be a bit more successful in the long run than papers accepted without revision. Even though one might feel bad about the need for a revision, it can be vastly useful in improving the quality of a paper after all. The number of revisions versus the number of citations in a yearly breakdown can be seen in the below figure.
Hopefully, some readers found this post interesting. Shall there be any ideas or observations regarding the analysis, I am happy to answer them. If you find any discrepancies in the dataset, let me know that as well so that I can fix it later on.